Explore Overview
Explore is a Reporting tool that allows you more performance and flexibility to manage your historical data.
Explore is available within the Reporting section [1]. To access it, simply select the Explore tab [2]:

You will see one set of Default Dashboards and one set of Default Reports:
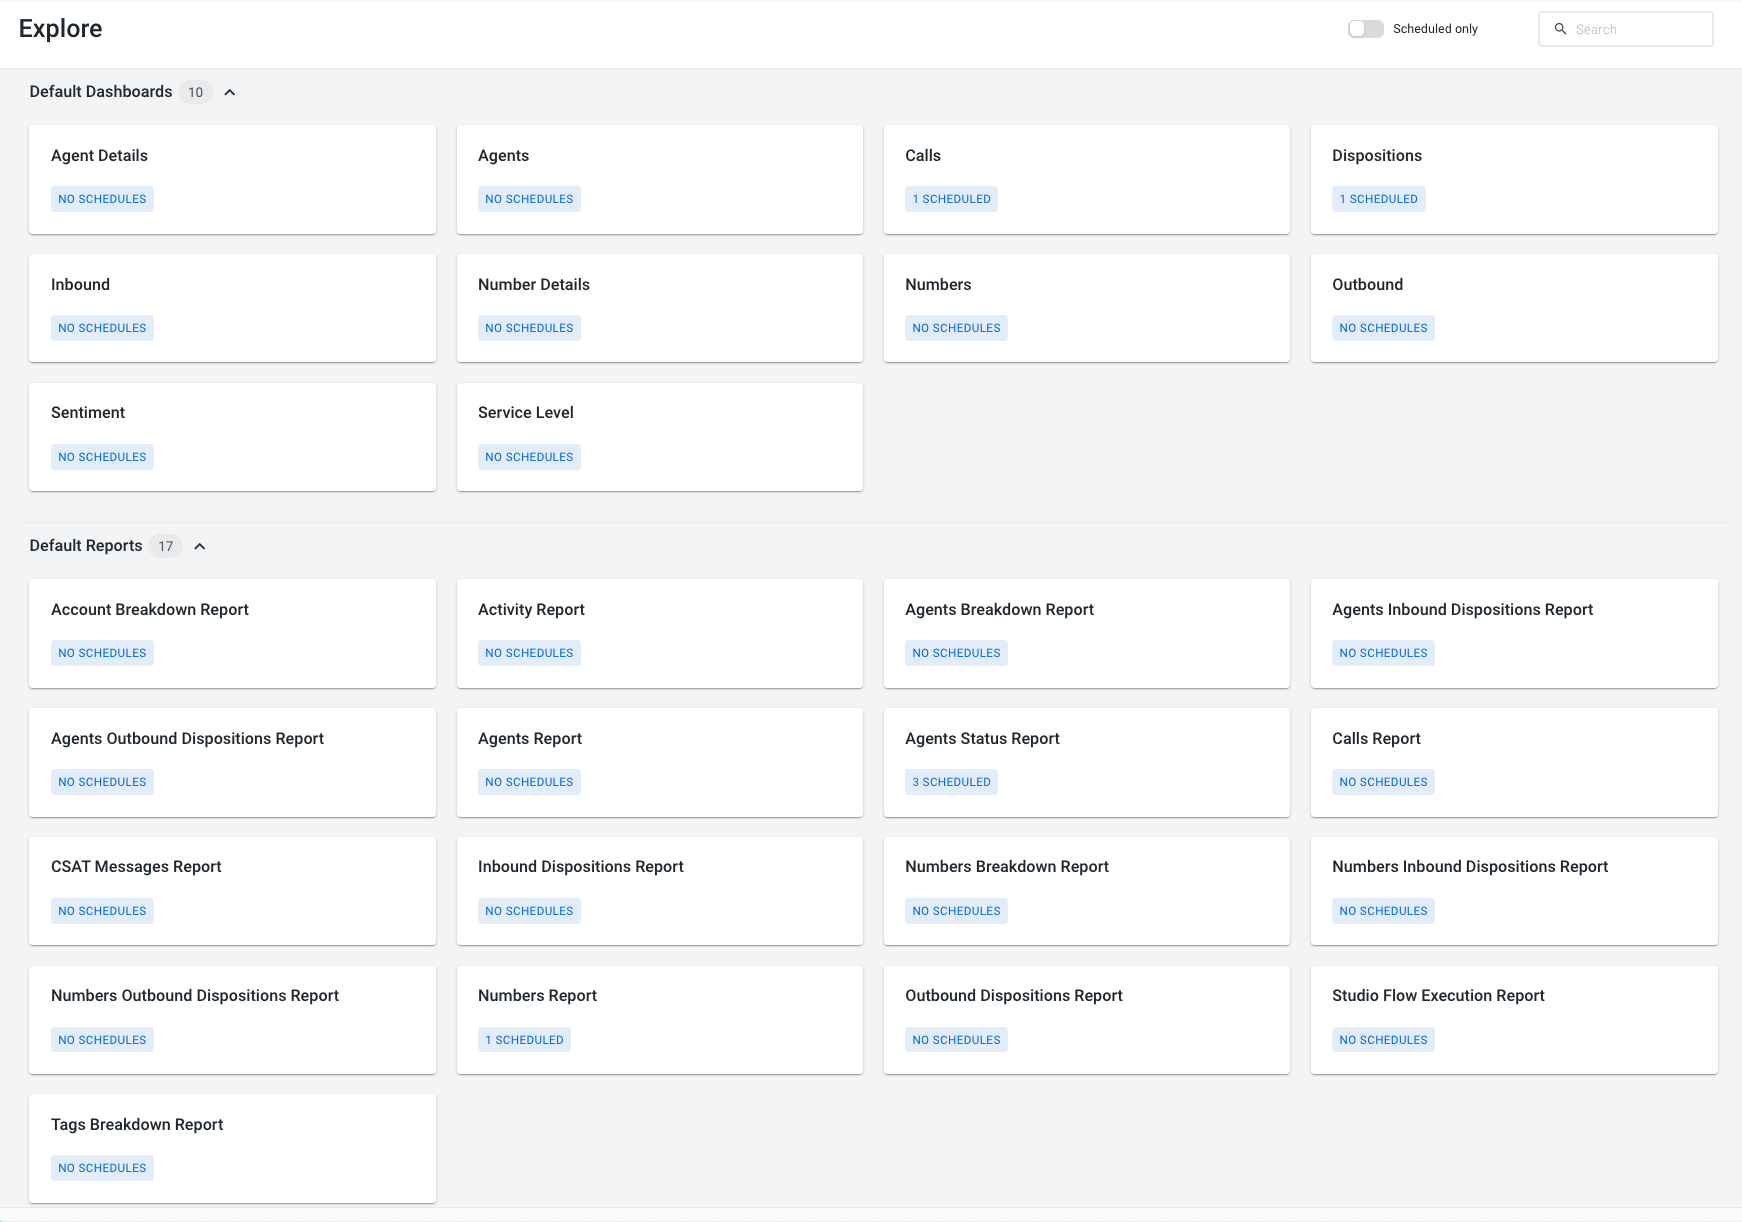
Note: The Default Dashboards correspond to the metrics tabs within the Reporting section (Inbound, Service Level, Outbound, etc.), while the Default Reports correspond to the Scheduled tab. They are based in the same data model.
All reports and dashboards are available from the landing page of Explore.
Each one offers advanced filtering and search options so that you can quickly find the data that you are looking for.
Dashboards
A dashboard allows you to quickly check related metrics, based on the filters that you apply.
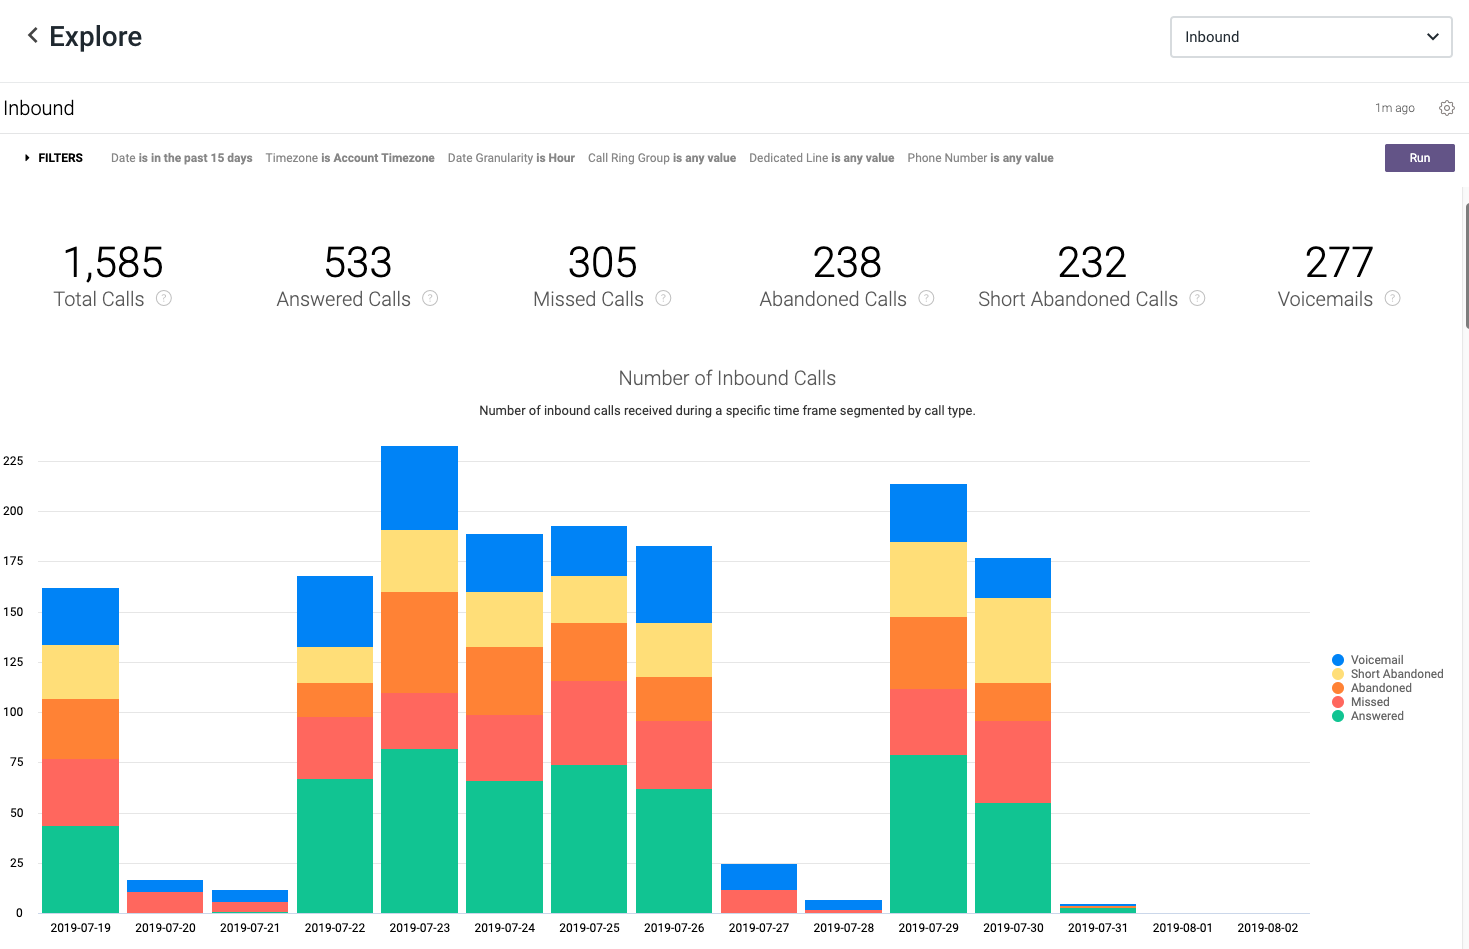
There are 10 default dashboards available in Explore:
- Agent Details.
- Agents.
- Calls.
- Dispositions.
- Inbound.
- Number Details.
- Numbers.
- Outbound.
- Sentiment.
- Service Level.
Reports
A report displays the answer to a single data question, allowing you to view, export and share more details about that data.

There are 17 default reports available in Explore:
- Accounts Breakdown Report.
- Activity Report.
- Agents Breakdown Report.
- Agents Inbound Dispositions Report.
- Agents Outbound Dispositions Report.
- Agents Report.
- Agents Status Report.
- Calls Report.
- CSAT Messages Report.
- Inbound Dispositions Report.
- Numbers Breakdown Report.
- Numbers Inbound Dispositions Report.
- Numbers Outbound Dispositions Report.
- Numbers Report.
- Outbound Dispositions Report.
- Studio Flow Execution Report.
- Tags Breakdown Report.
Accessing Dashboards and Reports
To open a dashboard or a report, simply click on it from Default Dashboards or Default Reports.
You can also expand or collapse these two sets, by clicking on the arrow:
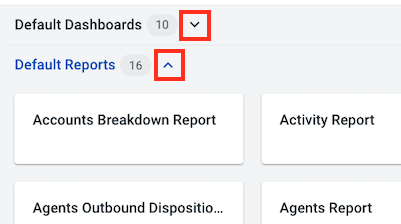
Besides this, you can quickly find dashboards and reports by:
- Searching for keywords.
- Selecting Scheduled only to view only reports and dashboards with a scheduled execution.
In the example below, we have narrowed down the visualization to show only the scheduled reports that contain the word “agent”:

Custom Dashboards and Reports
Besides the default dashboards and reports described before, customers on an Enterprise plan are also able to create their own reports and dashboards.
Note: If you wish to upgrade your account, please contact the Support team.
A Create button will be visible next to the search field at the top of the page. Once created, the custom dashboards and reports will be automatically placed in their corresponding section: My Dashboards or My Reports.
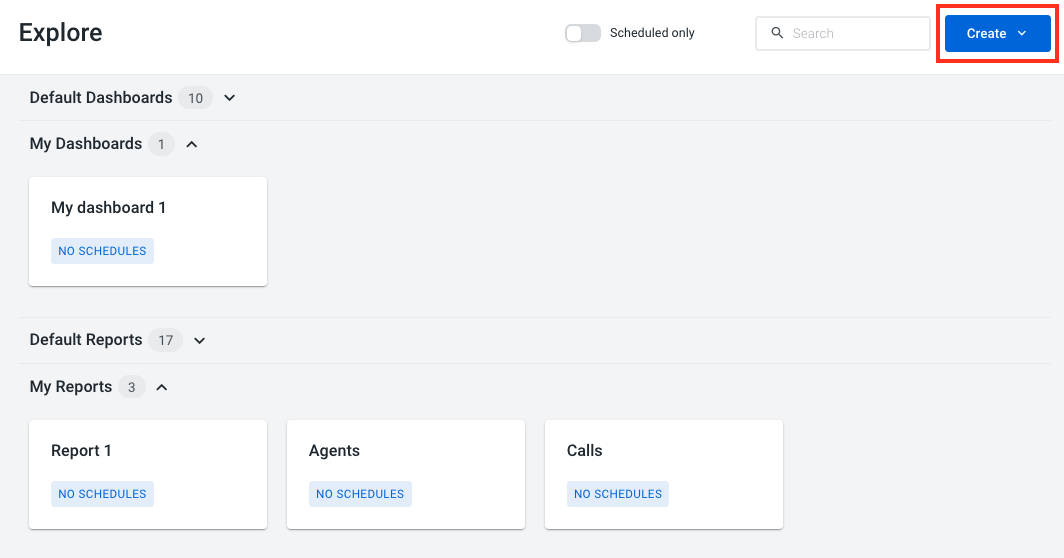
For more details, please check the articles Custom Create Reports and Custom Create Dashboards.
Permissions
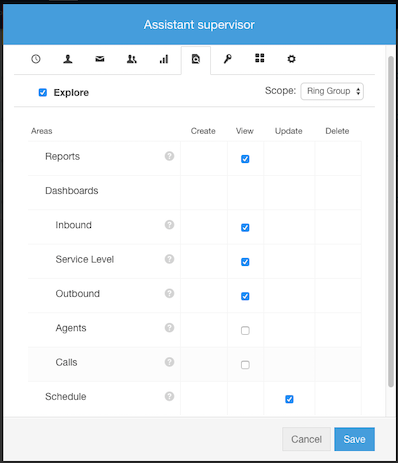
By default, users with the Admin or Supervisor role will have access to Explore.
If you wish to give access to other roles, or adjust the default permissions, you can do this from the Roles tab of the Admin section. Please be aware that, besides managing permissions for Explore on the respective permissions' tab, you also need to have the Reporting box ticked on the Reporting permission tab. If this option is not picked, Explore will not be visible.

The available permissions for Explore are:
- View: permission to view Reports or a specific Dashboard.
- Update: permission to create, edit and delete Schedules.
For example, a custom or cloned role can be configured to have permission to see only specific reports (View) and to create and manage schedules (Update):
Note: If you are the one who created a schedule, you will be the only user who can access the settings of that schedule. Conversely, you will not be able to configure the schedules that your colleagues set up.
